Google
Cloud Search

Worked with the GCP team to redesign the out of box Google Cloud Search for Google Workspace.

Role
UX Research
UX Design
Timeline
June 2021 - Dec 2021
Objective
- Reducing drop off rate
- Increasing average session time
- Improving user experience

Problem

Google Cloud search provides the Google search algorithm for enterprise documents as part of the Google Workspace Enterprise package. A Workspace client wanted to integrate Cloud Search as part of their enterprise workflow however the default Cloud Search Dashboard had problems

  • Limited Functionality
  • Low active daily users
  • Low engagement

User Flow

The website user flow was measured using Google Analytics event tracking indicating three immediate issues with how users were using the platform

  • Redundant Homepage elements: 93% of users were using search ignoring the majority of the functions on the homepage.
  • Inefficient Search: 61% of users did not find their document in the first page of search.
  • High Drop-off: Only 14.98% of the users successfully found the document they were looking for.

User Research

Interviews

We conducted 6 semistructured user interviews to answer three main questions.

  1. Why was nobody using the home page features ?
  2. What documents were people looking for?
  3. Where were people going after dropoff ?
HomePage
Most users were used to seeing high priority information on the homepage of their dashboards.
Default cloud search only provided previously opened documents and events.
Documents
Default cloud search only supports google docs.
Most employees were used to working in a variety of different documents including Sharepoint, documents from SAP Hana and internal PDFs.
Dropoff
Dropoff reasons
1. Did not find required documents.
2. Went to the OKR dashboard to compare values with documents.
3.  Emailed tech support to upload documents.

Survey

Surveyed 48 employees across 4 company verticals and 3 seniority levels ( anonymized for NDA ) with an eligibility criteria of
1. Average 2-3 times dashboard usage per week or Total 10 times used over lifetime.
2. No COI with project outcome or project stakeholders.

Questions

The survey covered two main areas of inquiry
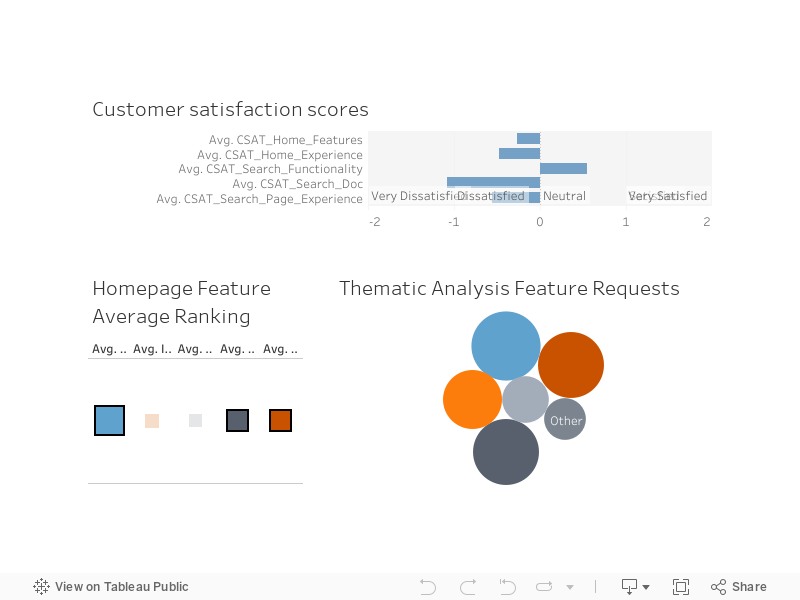
1. User Experience Questions: Customer Satisfaction Score to measure user experience  

  • Home Page Features: Quality of features available on the home page.
  • Home Page Experience: Overall experience of the home page.
  • Search Page Functionality: Performance of the search feature.
  • Search Page Document : Experience of documents they search for.
  • Search Page Experience: Overall experience with the search page.


2. Feature Requirements Questions: Quantitative data to build on interview insights to inform design decisions

  • Home page feature ranking: Based on technical constraints
  • Feature requests: open ended feedback

Key Survey Insights

HomePage
Features
The most highly ranked feature was integrating an existing internal OKR dashboard, including KPIs regarding their company vertical and org notifications.
Customer Satisfaction
The lowest CSAT scores were for the availability of documents ( even though the actual search functionality was fairly positive ).
Drop-off
Suggestion
5 main features emerged from a thematic analysis of the open ended feedback.
Survey Results

Designs

Searce Page Feature Prioritization

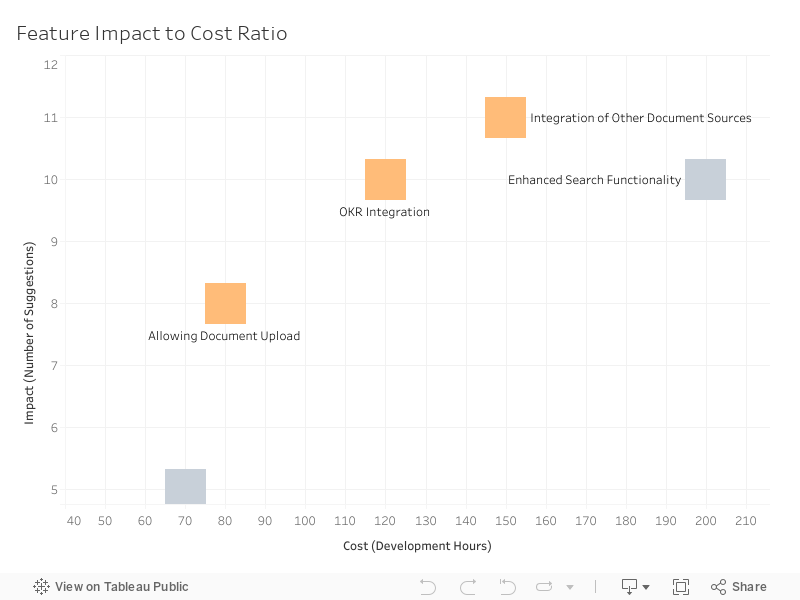
Features from the drop-off suggestions were prioritized based on a cost to impact graph
- Cost: measured in hours to develop
- Impact: no of suggestions per feature

Survey Results

Selected Features

HomePage
Features

Home Page Features Selected based on ranking

  1. OKR Integration: 1.667
  2. Recent Documents: 2.771
  3. Notifications: 2.845
Customer Satisfaction

Search Page Features
based on impact-cost

  • Document Upload
  • OKR Document integration
  • Other Sources

Prototypes

The design process included
1. Low fidelity wireframes
2. Feature Scoping Interviews
3.  High Fidelity Prototypes
OKR Dashboard
Dashboard requirements
1. Timeline
a. OKR Target | Limit
b. Time Format
2. OKR Info
a. Current
b. % from Target | Limit
3. Timeline Info
a. Daily | Monthly
b. Metrics out of bound
c. Days without incident
OKR Dashboard
Dashboard requirements
1. Timeline
a. OKR Target | Limit
b. Time Format
2. OKR Info
a. Current
b. % from Target | Limit
3. Timeline Info
a. Daily | Monthly
b. Metrics out of bound
c. Days without incident
Notifications
Features included
1. OKR Alerts
2. Email integration
3. Messaging
Home Page Features
Filters
Filters based on added document metadata.
Search Document Features
New Features Added
1. Document Type
a. SharePoint
b. Microsoft Docs
2. Source Type
a. SAP Hana
b. Google Bigquery
3. OKR and Metadata
a. Integrating OKR
b. Access Control
c. Dept Info
d. Quick Look
Upload Document
Document metadata required
1. Access Control
2. Information Tags
3. Document Source
Search Page Features

Metrics Used to measure Success

The HEART metrics were used to measure user experience

  1. Happiness: Customer Satisfaction Scores
  2. Engagement: Average Session Time, Active Daily Users
  3. Adoption: Increase in use of homepage
  4. Retention: Not measured ( all internal users )
  5. Task Success: % of users finding documents

Impact

Defining Success

Customer
Satisfaction
Avg Increase in CSAT: 14%
1. Highest: Homepage Feat.
2. Lowest: Search Func.
Engagement
Increase in
1. Avg Session Time: 54%
2. Active daily users: 48%
Adoption
7.5x increase in usage of home page features
Task Success
96% users found the documents they were looking for and didn't drop off.